Estimating a Population Proportion
Inferential statistics focuses on using sample data to make generalizations about a population. In this context, estimating a population proportion involves utilizing sample proportions to approximate the actual proportion of a characteristic within a population. This concept is foundational in understanding how statistics enable data-driven decisions.
For instance, suppose a random survey of 1,200 adults was conducted to assess awareness of a new nationwide anti-smoking campaign. Out of those surveyed, 930 individuals reported being aware of the campaign. This results in a sample proportion of 77.5% which will be used to estimate the percentage of all U.S. adults who are aware of the campaign. Applying the principles of inferential statistics it will be clear that around 77.5% of adults are aware of the campaign.
Notation for Proportion
The following notations are used in discussing proportions:
- \( p \): Population proportion
- \( \hat{p} \): Sample proportion of successes (\( \hat{p} \) is pronounced "p-hat") found by \(\cfrac{x}{n}\)
- \( 1 - \hat{p} \): Sample proportion of failures
Point Estimates
Definition: Point Estimate
A point estimate is a single value (or point) used to approximate a population parameter. The sample proportion (\( \hat{p} \)) is the best point estimate for the population proportion (\( p \)).
Example : Find the Best Point Estimate
A survey conducted by KRC Research asked 1,002 respondents if they felt vulnerable to identity theft. Among them, 531 said “yes.” What is the best point estimate for the proportion of adults who feel vulnerable to identity theft?
Solution
The best point estimate is the sample proportion:
\[ \hat{p} = \frac{531}{1002} \approx 0.5309 \]
Thus, the best estimate for the population proportion is approximately 53.1%.
Example : Finding a Point Estimate from Survey Results
In a survey of 850 college students, 72% indicated that they believe financial literacy should be a required part of the general education curriculum. Find the best point estimate for the percentage of all college students who feel this way. Also, how many students in the sample believed financial literacy should be required?
Solution
The best point estimate for the population proportion is the sample proportion, which is given as 72%. So, the best point estimate is 72%.
To find the number of students in the sample who believe financial literacy should be required, calculate:
\[ 0.72 \times 850 = 612 \]
So, 612 students in the sample supported requiring financial literacy.
Confidence Intervals
Point estimates alone do not convey the accuracy of the approximation. Confidence intervals provide a range of values within which the true population proportion is expected to lie. This interval is based on the sample data and reflects a specified level of confidence (e.g., 95%).
Definition: Interval
In mathematics, an interval is a set of numbers with the property that any number between two endpoints is also included. For example, \([0, 1]\) includes all numbers between 0 and 1, including 0 and 1.
Example : Interval Forms
Write the following statements as intervals using the correct grouping symbols.
- \( -4 \leq x \leq 3 \)
- \( 0.421 \leq x < 0.723 \)
- \( -2 < z < 2 \)
- \( x > 6 \)
Solution
- \( -4 \leq x \leq 3 \) is written as \([-4, 3]\).
- \( 0.421 \leq x < 0.723 \) is written as \([0.421, 0.723)\).
- \( -2 < z < 2 \) is written as \((-2, 2)\).
- \( x > 6 \) is written as \((6, \infty)\).
Interactive Confidence Interval Tool
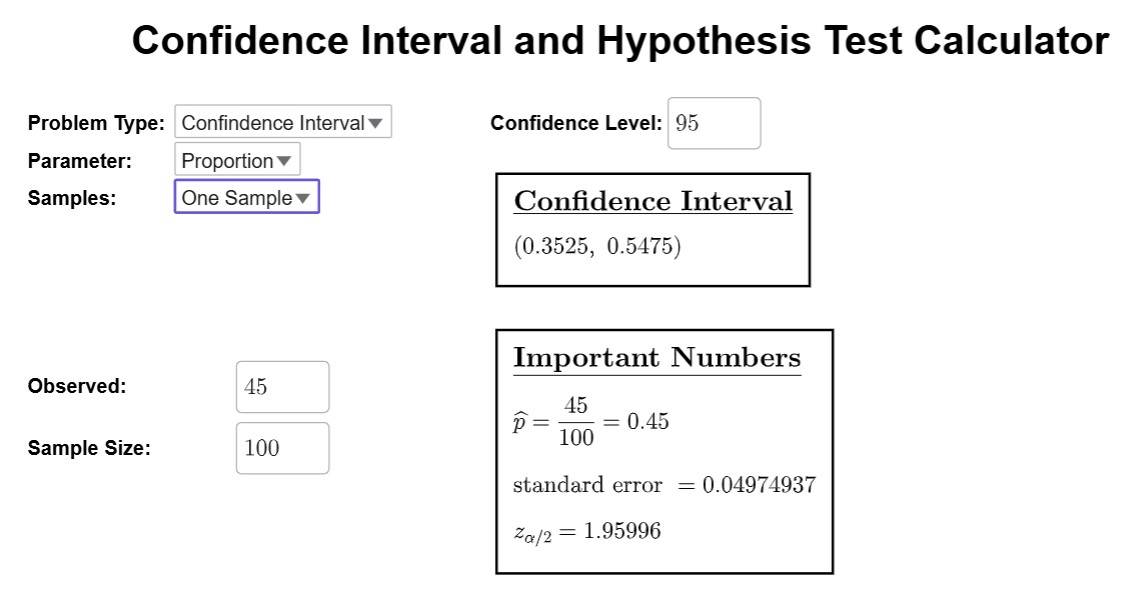
Interactive calculator for confidence intervals and hypothesis testing.
Opens the calculator in a new tab.
Examples: Confidence Intervals
Example : Confidence Interval for a Proportion
In a survey of 427 women, 29% of them indicated they purchase books online. Identify the number of women that said they purchase books online. Then construct a 95% confidence interval for the true proportion of women that said they purchase books online.
Solution
Using technology, the 95% confidence interval for the population proportion is found to be \( [0.256, 0.324] \).
Interpreting Confidence Intervals
The correct interpretation of a confidence interval requires precise language. For example, if a 95% confidence interval for a population proportion is \([0.256, 0.324]\), the correct interpretation is:
"We are 95% confident that the interval from 0.256 to 0.324 contains the true population proportion."
Common incorrect interpretations include:
- "There is a 95% chance that the true proportion lies between 0.256 and 0.324."
- "95% of sample proportions will fall within this interval."
Example : Interpreting a Confidence Interval for a Proportion
In a study of 1,200 patients who visited a community health clinic, 276 reported experiencing side effects after receiving a new vaccine. Construct a 95% confidence interval for the proportion of all patients who may experience side effects after receiving this vaccine. Then interpret the confidence interval.
Solution
First, calculate the sample proportion:
\[ \hat{p} = \frac{276}{1200} = 0.23 \]
Now use GeoGebra to find the confidence interval boundaries:
The confidence interval in decimal form is:
\[ (0.2077,\ 0.2523) \]
Converting to percentages:
\[ (20.77\%,\ 25.23\%) \]
Interpretation: We are 95% confident that the true percentage of all patients who may experience side effects after receiving this vaccine is between 20.77% and 25.23%.
$$\tag*{\(\blacksquare\)}$$
Margin of Error
Definition: Margin of Error
The margin of error (\(E\)) represents the maximum expected difference between the true population parameter and the sample estimate. It quantifies the uncertainty of an estimate.
In election polling, results are often reported with a margin of error. For example, a poll may state that 48% of respondents plan to vote for a particular candidate, with a margin of error of \(\pm\)3%. This means the true percentage of voters supporting the candidate could reasonably be as low as 45% or as high as 51%. In interval form, this would be written as (45%, 51%).
Useful Formulas for Margin of Error and Sample Proportion
When a confidence interval is given in the form \((\text{lower bound}, \text{upper bound})\), the margin of error \(E\) can be found using the formula:
\[E = \frac{\text{upper bound} - \text{lower bound}}{2}\]
Similarly, the sample proportion \(\hat{p}\) can be estimated by averaging the endpoints of the interval:
\[\hat{p} = \frac{\text{upper bound} + \text{lower bound}}{2}\]
Example : Writing Confidence Intervals in Multiple Formats
Rewrite the interval \( 0.256 < p < 0.324 \) in interval notation and margin of error format.
Solution
In interval notation, the confidence interval is written as:
\((0.256, 0.324)\)
To express this as a margin of error, calculate the midpoint and margin of error:
\[ \text{Point Estimate: } \hat{p} = \frac{0.256 + 0.324}{2} = 0.29 \]
\[ \text{Margin of Error: } E = \frac{0.324 - 0.256}{2} = 0.034 \]
Thus, the confidence interval can also be written as:
\[ \hat{p} \pm E = 0.29 \pm 0.034 \]
Example : Titanic Data
Use the Titanic dataset linked below to estimate the proportion of passengers who survived. Construct a 90% confidence interval for the proportion of people who survived the Titanic crash using the data below and write the interval in margin of error format.
Because of the amount of data, this dataset is omitted from viewing but can be viewed visually in a scrollable table by clicking the button below or by downloading the data here: Download Titanic Data.
This button loads and displays data from a CSV file with Titanic passenger information on this page.
Solution
Using the dataset, count the number of survivors (\(x\)) and the total number of passengers (\(n\)). Let \( \hat{p} = x/n \). Use technology to compute the confidence interval, ensuring assumptions are met for inference.